


The first hurdle that has to be overcome is to clearly define what is a “hard” and what is a “soft” cost. There are almost as many owner delivery models and cost accounting models amongst American Universities as there are American Universities. In order to remove this source of variability, a very purist definition of hard costs being defined as “construction and construction contingency”, and soft costs being defined as “everything else” was used to help sort the data for consistent comparisons. To further categorize hard costs, the Construction Specifications Institute’s MasterFormat® system was used.
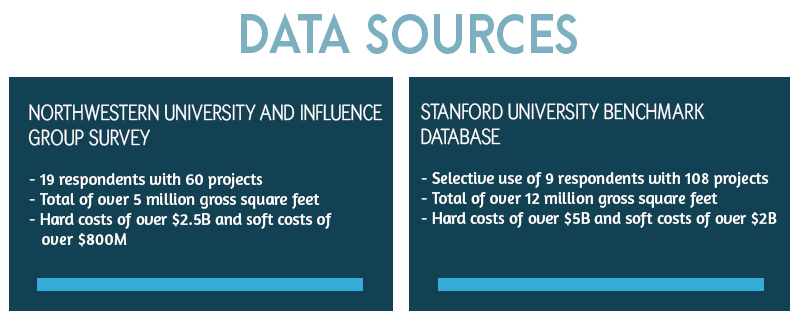
The second hurdle is to get access to data that can be categorized and compared. As it turns out, this is not a hurdle at all. Most universities are willing to share data as well as best practices and there are many professional forums that assist with this sharing and benchmarking. Stanford University’s Department of Project Management hosts one of the best examples of this type of cooperation with their Benchmark database. Data from 108 recent projects from across the country, totaling over 12 million square feet and over $7B was used for this analysis. A Northwestern University sponsored survey collected detailed data from an additional 19 respondents on 60 current projects, totaling over 5 million square feet and over $3B, which was also used in this analysis.
The final hurdle is to remember that the data is self-reported and does not represent all projects in the higher education portfolio. Although an attempt is made to ensure that the below results are directionally correct with national sources such as RSMeans Building Construction Cost Data and Engineering News-Record Construction Economics, the data analyzed is not accurate enough to be conclusive nor is the sample size large enough overcome effects from outliers. That said, the results do serve to provide a benchmark to allow higher education construction leaders to isolate opportunities for improvement within their respective program.
Result Number 1.
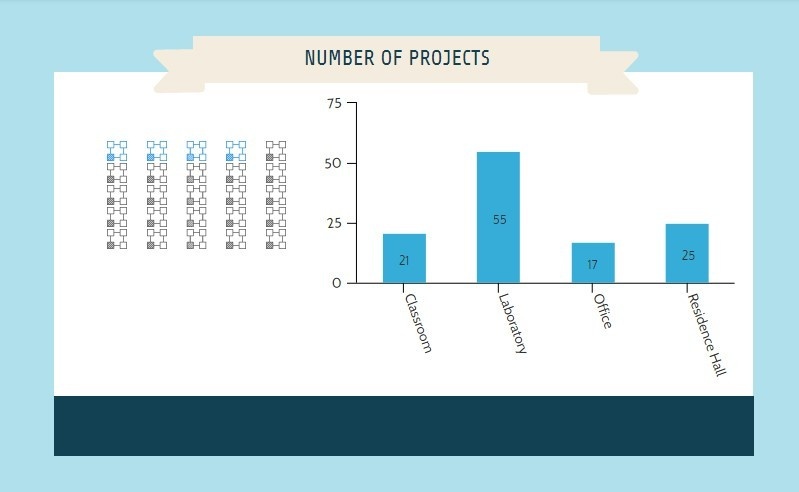
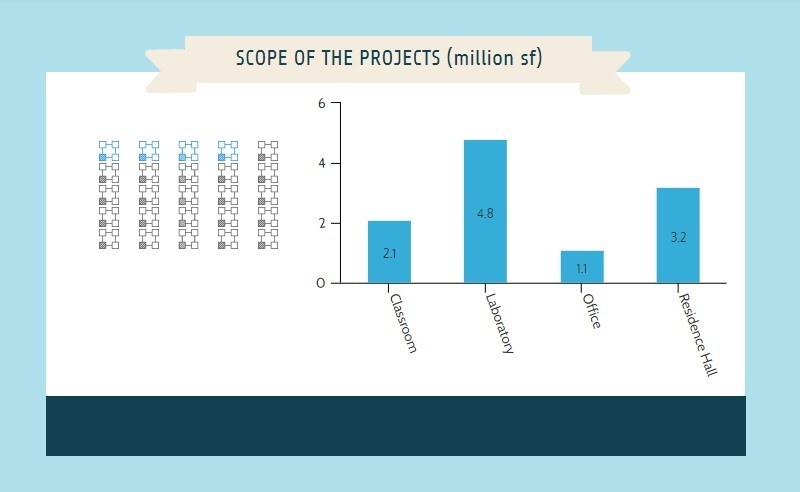
Higher education construction is booming in both the public and private sector. Research is leading the pack with 35% of the reported projects being new or renovated laboratories. New or renovated residence halls account for 16% of the projects, new or renovated classroom buildings account for 13%, and new or renovated office buildings account for 11% of the reported projects. All other primary use types reported make up only 25% of the projects.
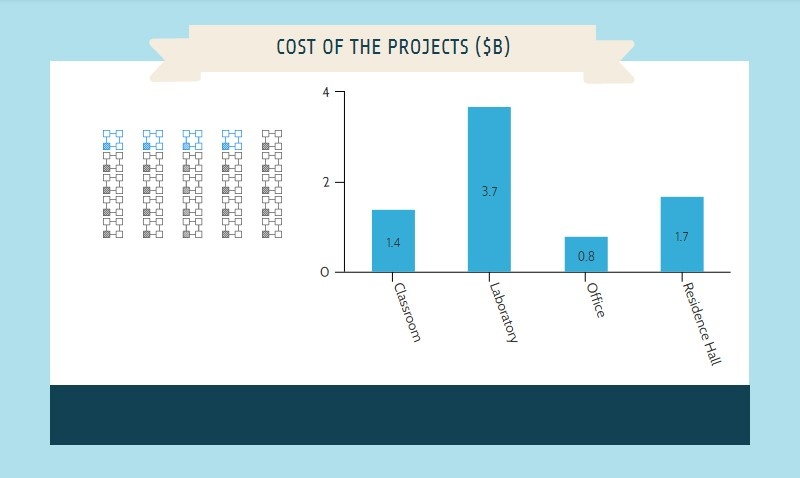
The below table shows that the number of projects, the scope of the projects and the cost of the projects are not always proportional. Scope is reported in millions of square feet (sf) and unless otherwise noted, this refers to gross square feet constructed or renovated.
Result Number 2.
Even within the higher education portfolio, there is expected variability in project cost by primary building program. Several universities and hospitals reported healthcare occupancy projects in the Northwestern survey, but these were primarily fit-outs of existing space. As fit-outs, the average total project cost of $743/sf is more expensive than all but two higher education new construction categories.
New laboratory construction averages $812/sf. The lowest cost of $313/sf was reported as a laboratory, but the reported program descriptor would cause this project to be categorized as a classroom space at many universities. Wet laboratories dominate the upper end of the scale with the most expensive at $1,879/sf. 26% of the reported projects are over the $1,000/sf benchmark and are all high acuity wet labs by their program narratives. This subcategory has an average total project cost of $1,186/sf.
Student and Visitor Centers have a reported total project cost averaging $808/sf. Although the sample size is small for this category, the variability of total project cost between private universities, state universities and community colleges is smaller than all other categories in the higher education portfolio. Although inconclusive without more data, it appears that those institutions investing in this category of building are targeting similar outcomes regardless of their financial base.
Result Number 3.
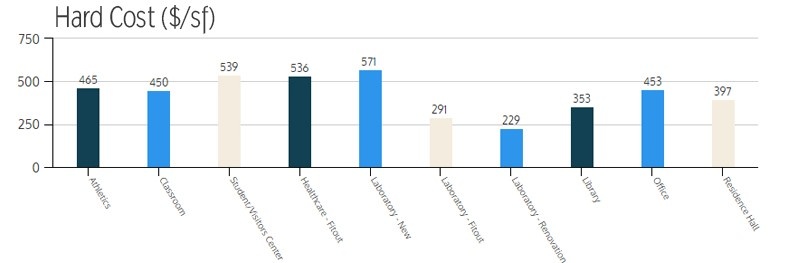
Once normalized for inflation using project start dates and for geographical diversity using area cost factors, the standard deviations in hard costs by category are reasonably small with the exception of laboratories as mentioned previously. Program acuity appears to be the significant driver.
There is variation in the ratio of hard costs to total project costs, (hard plus soft costs). The mean ratio of hard costs to total project costs is 0.72 and the mode is 0.70, which correlates to 69% of the projects submitted.
Most higher education institutions report using a variety of construction contract vehicles with Request for Proposal and Guaranteed Maximum Price being primary. No significant project hard cost difference is attributable to construction contract vehicle choice in the data provided.
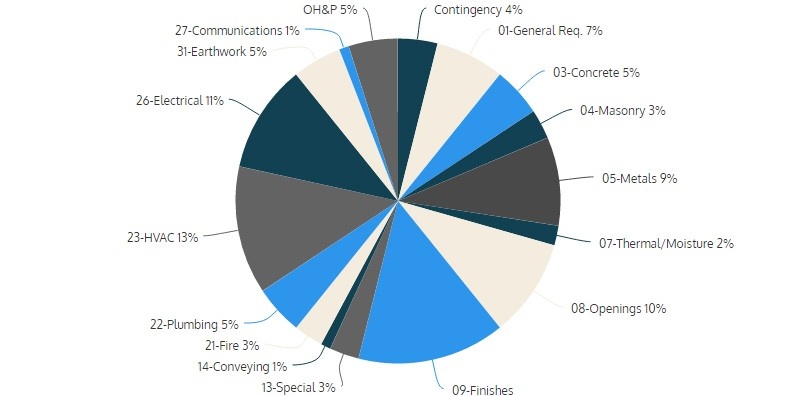
Contractor Overhead and Profit (OH&P) averaged 5% of hard costs, but varied greatly between 1.41% and 12.55% on respondent data. Typically, OH&P is tied to contractor risk. There is insufficient data to draw conclusions on the reasons behind this variability as it does not appear to be linked to institution type, project acuity or project schedule.
Contingency varied between 0% and 8%, with an average over the dataset of 4%. Drivers of this variability include construction contract vehicle type and accounting differences between institutions. Although not supported by data, many state and community schools have reported legislated accounting practices that impact the project contingency line.
General Requirements (Conditions) averaged 7% and varied between 3% and 13% of hard costs for the projects submitted. There was a larger correlation to the institution as the driver than to category of project.
Construction Specifications Institute (CSI) section 09 for Finishes averaged 15% of hard costs with strong correlation both by institute and project category for the higher education portfolio. Additionally, CSI section 23 for Heating, Ventilation and Air Conditioning averaged 13% of hard costs and has a strong correlation to project category with no significant correlation to geographical location.
The below graph breaks out hard cost averages by CSI section across the portfolio:
Result Number 4.
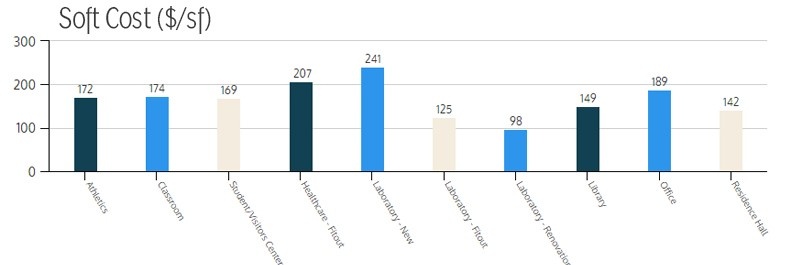
Soft costs were also normalized for inflation using project start dates and for geographical diversity using area cost factors. Whereas this is standard practice for hard cost normalization, there was not a clear direction on appropriateness for soft costs. In the end, it was determined that applying the area cost factors allowed a directional correctness for comparisons across the country.
There is much greater variability in soft costs than in hard costs attributable to multiple models of project management reimbursement and project accounting across the higher education portfolio.
Reimbursement models include centrally funded, fully reimbursable through a project charge and hybrids between the two. Those that are in a fully reimbursable or hybrid model have charges that range from $1/sf to $25/sf. Regardless of the model, about 75% of the respondents listed a University Fee separate from a reimbursable project management fee and about half list a separate finance charge.
Nearly all respondents are commissioning their facilities. The average cost of commissioning is 1% of the total soft cost and ranges from $0.56/sf to $1.86/sf.
Permit fees have the greatest variability of all hard and soft costs reported. The respondent average is 0.3% of hard costs, but the range is between 0.15% to nearly 2% of hard costs.
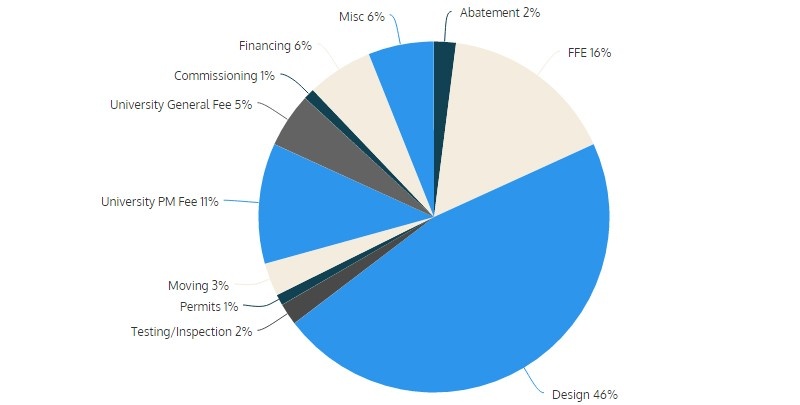
Design is the largest soft cost averaging 47% of this category. Furniture, Fixtures and Equipment (FFE) averages 16% of soft costs across the dataset, although several projects had no costs for FFE and several university models made FFE procurement a responsibility of the end user and accounted for separately. The below graph breaks out the soft costs by category.
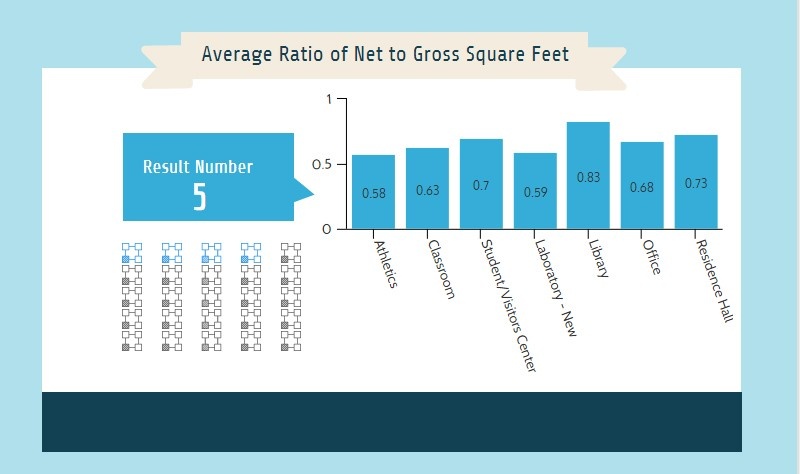
Result Number 5.
The average ratio of net to gross square feet for the projects sampled is 0.69. New laboratories have the largest variation in net to gross feet with ratios as low as 0.45 and as high as 0.88. The mean ratio for new laboratories is 0.59 and the project descriptors do not correlate net to gross with laboratory acuity.
The average net to gross square feet ratios by category are listed in the table below:
Conclusions:
- There is significant variation in how projects are managed and how costs are captured amongst the higher education sector.
- There is significant variation in the ratio of construction to total project cost, but the mean is 0.72 and the mode is 0.70 – submitted by respondents on 69% of the projects.
- New laboratories have the largest variation in net to gross square feet ratios with a low of 0.45, high of 0.88, mean of 0.59 and mode of 0.52.
The most important conclusion is that higher education portfolio managers are willing to share best practices and benchmark data in both formal and informal settings. This practice improves the national portfolio and reduces the overall cost to each institution and to the sector as a whole. Additionally, the data clearly shows that although each project is unique and many cost accounting, management models and construction delivery vehicles exist across the sector, both the hard and soft cost benchmarks are of a sufficient quality to use for parametric planning. Finally, the building program category remains the largest differentiator for both total project cost and net to gross ratio.


-May-04-2026-11-19-05-8005-AM.png)
-1.png)


Comments